COCO研究院

 找回密碼
 註冊
搜索
查看: 2133|回復: 7

請問amibroker報表上少了幾筆交易問題

[複製鏈接]
發表於 14-10-10 08:44 | 顯示全部樓層 |閱讀模式
請教版上先進
我使用amibroker編輯均線策略,以非多即空的方式回測,
可是報表上很多筆交易會不見,會出現連續兩個long或連續兩個short的情況,
在日線上回測沒有發現這問題,但在分線上回測就會有此現象發生,
請問是我哪裡沒有設定到嗎?
如下列例子:(測輕原油 CL,30分K,只有一條均線,往上交叉做多,往下交叉做空)

SetPositionSize(1, spsShares);
SetOption("MaxOpenPositions", 1);
SetOption("InitialEquity", 500000);
SetOption("FuturesMode", 1);
SetOption("CommissionMode", 3);
SetOption("CommissionAmount", 2.5);
RoundLotSize = 1;
TickSize = 0.01;   
MarginDeposit = 5000;
PointValue = 1000;

SetTradeDelays(1, 1, 1, 1);
BuyPrice = CoverPrice = Open;
SellPrice = ShortPrice = Open;

MyMA = EMA(C,50);

Buy = Cross(Close , MyMA) ;
Sell = Cross(MyMA , Close) ;
Short = Cross(MyMA , Close) ;
Cover = Cross(Close , MyMA) ;

Buy = ExRem(Buy, Sell);
Sell = ExRem(Sell, Buy);
Short = ExRem(Short, Cover);
Cover = ExRem(Cover, Short);

//--------------------------------------------------

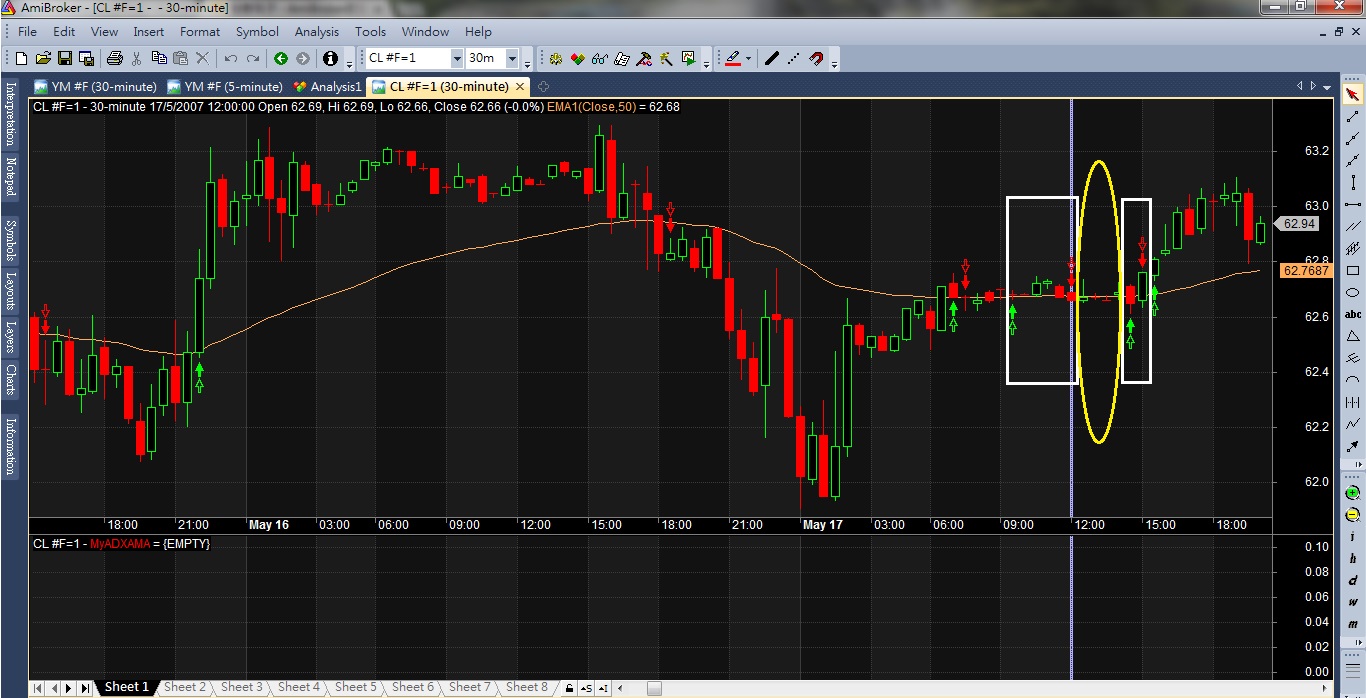
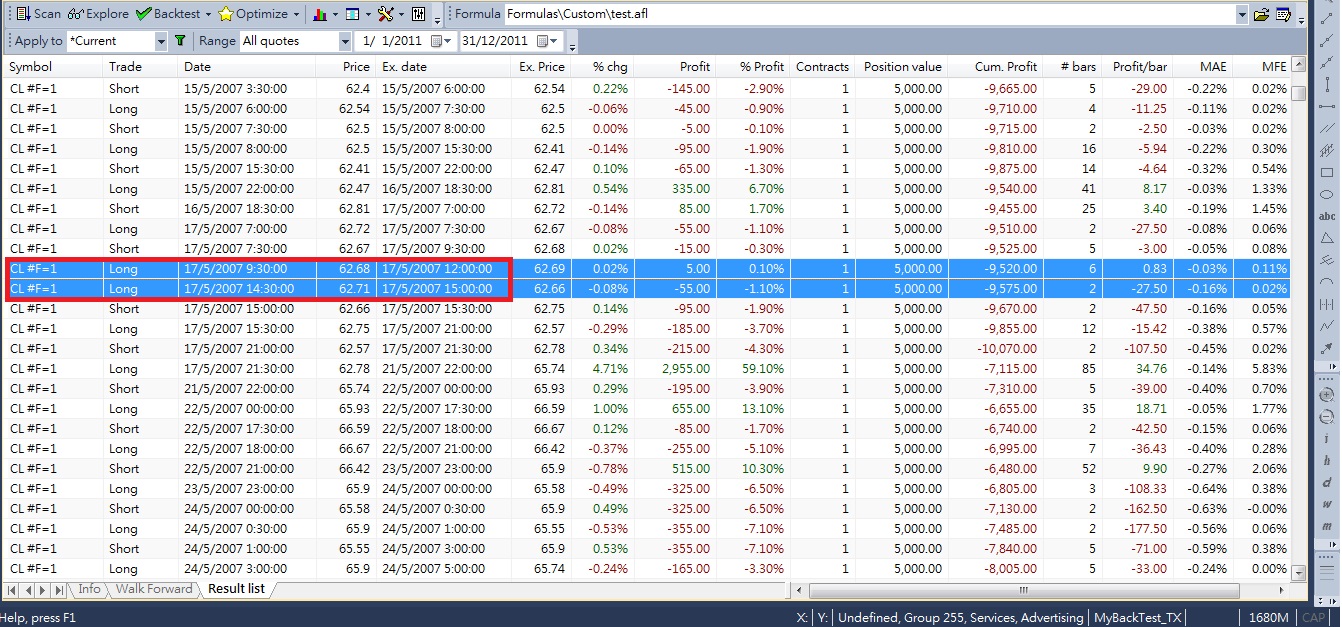
回測報表上卻在一些時間點同時出現兩筆連續short或兩筆連續long
11.jpg

22.jpg

如上圖中間黃色部分的short部分在回測報表上卻沒有出現,
理論上不是應該不是做多不然就只有做空,但是將交易箭頭顯示在k線圖上又有看到這筆交易,
在其它時間點也會有這種情況發生,如果測10分線或5分線會更多,
請問是需要做什麼設定還是程式語法上有什麼問題嗎?
謝謝
發表於 14-10-10 09:54 | 顯示全部樓層
本帖最後由 joshsmi 於 14-10-10 09:57 編輯

Upload project file (extension .apx --> File>Save) and your used 30-minute data till end of may 2007 to reproduce your result.
發表於 14-10-10 16:16 | 顯示全部樓層
不知道把這兩行對調回測結果會一樣嗎?
Cover = ExRem(Cover, Short);
Short = ExRem(Short, Cover);

評分

參與人數 1金錢 +2 收起 理由
nsmvjmsojki + 2 感謝分享,但已嘗試對換過仍然一樣的情況.

查看全部評分

發表於 14-10-10 19:00 | 顯示全部樓層
ExRem is not required in Backtest.
 樓主| 發表於 14-10-10 23:40 | 顯示全部樓層
issue.rar (519.23 KB, 下載次數: 252)

Attached is my *.apx and history data files.
Please have a look and thanks a lot for your help.


發表於 14-10-11 03:16 | 顯示全部樓層
本帖最後由 joshsmi 於 14-10-11 03:22 編輯
nsmvjmsojki 發表於 14-10-10 23:40
Attached is my *.apx and history data files.
Please have a look and thanks a lot for your help.

It is solved.

Go to backtest settings --> portfolio tab and set limit tade size from 10 to zero.
Then it will show the short trade as seen in the chart.


From help:

"
Limit trade size as % of entry bar volume
This prevents from entering the trades greater than given percentage of entry bar's volume. For example if backtesting daily data and today's volume for thinly traded stock is 177,000 shares, setting this to 10% will limit the maximum trade size to 17,700 shares (10% of total daily volume). This prevents from 'affecting the market' by huge orders."

The chart will show all raw signals despite that setting

評分

參與人數 1金錢 +2 收起 理由
nsmvjmsojki + 2 感謝分享

查看全部評分

發表於 14-10-11 03:38 | 顯示全部樓層
As you can see in the quote editor the volume is very low.
So if you set a trade size limit in portfolio tab then trade will not be entered but raw signal still be shown in chart.

評分

參與人數 1金錢 +2 收起 理由
nsmvjmsojki + 2 You are so nice.

查看全部評分

 樓主| 發表於 14-10-11 08:00 | 顯示全部樓層
Thanks a lot for your help.
The issue has been solved.

您需要登錄後才可以回帖 登錄 | 註冊

本版積分規則

手機版|Archiver|站長信箱|廣告洽詢|COCO研究院

GMT+8, 24-5-2 11:39

Powered by Discuz! X3.4

Copyright © 2001-2023, Tencent Cloud.

快速回復 返回頂部 返回列表
理財討論網站 | AI繪圖AI超擬真美女AI beauty AI Stable DiffusionAI正妹AI Lookbook